 · Field to Decision
STORY 01 / 05
· Field to Decision
Lawyers denied it for three years. A zip-code map ended it in 24 hours.
Syncor International held exclusive distribution rights to DuPont's Cardiolite, the best-selling cardiac imaging agent in the US, within contract territories surrounding each of its radiopharmacies (Syncor FY2001 10-K: “exclusive distributor… in specified geographic areas surrounding most of our U.S. radiopharmacies”). Territories were zip-code defined with roughly a 90-mile reach. Cardiolite reached 41.2% of Syncor's total sales, and Syncor moved over 80% of US unit doses.
DuPont's pricing assumed two doses per vial. Syncor's pharmacies compounded under state practice law, the Florida rules John co-revised, which most states copied. Operating as licensed nuclear pharmacies, they legally drew 8 to 12 doses per vial, and everything past roughly 1.5 doses was pure margin. DuPont's lawyers concluded the agreement couldn't be broken. So competitors started appearing at the territory edges and their sales leaked inward. Seven such facilities were counted. DuPont denied everything.
On the second visit, DuPont handed over a thick stack of sales data in awkward formats, apparently without noticing it carried zip codes and end customers (hospitals buy the drug, not patients). GIS was young; John was an early ESRI adopter for distribution modeling. That night he hand-transcribed the data and layered it over a zip-code map. The incursions lit up.
He then transcribed all of it, three years and every market, and mapped 27 major markets showing the incursions growing year over year. In the conference room, counsel waved off year one, then year two, then year three, then another city, then a third. Then Syncor's lawyers asked John to leave the room with the maps on the table.
Won through improved data quality and visualization (resume of record; magnitude corroborated by the scale of the purchase base in SEC filings). The FTC later dissected this exact exclusivity-and-territory model in its 2015 Cardinal Health matter. The market power was real enough that regulators studied it.
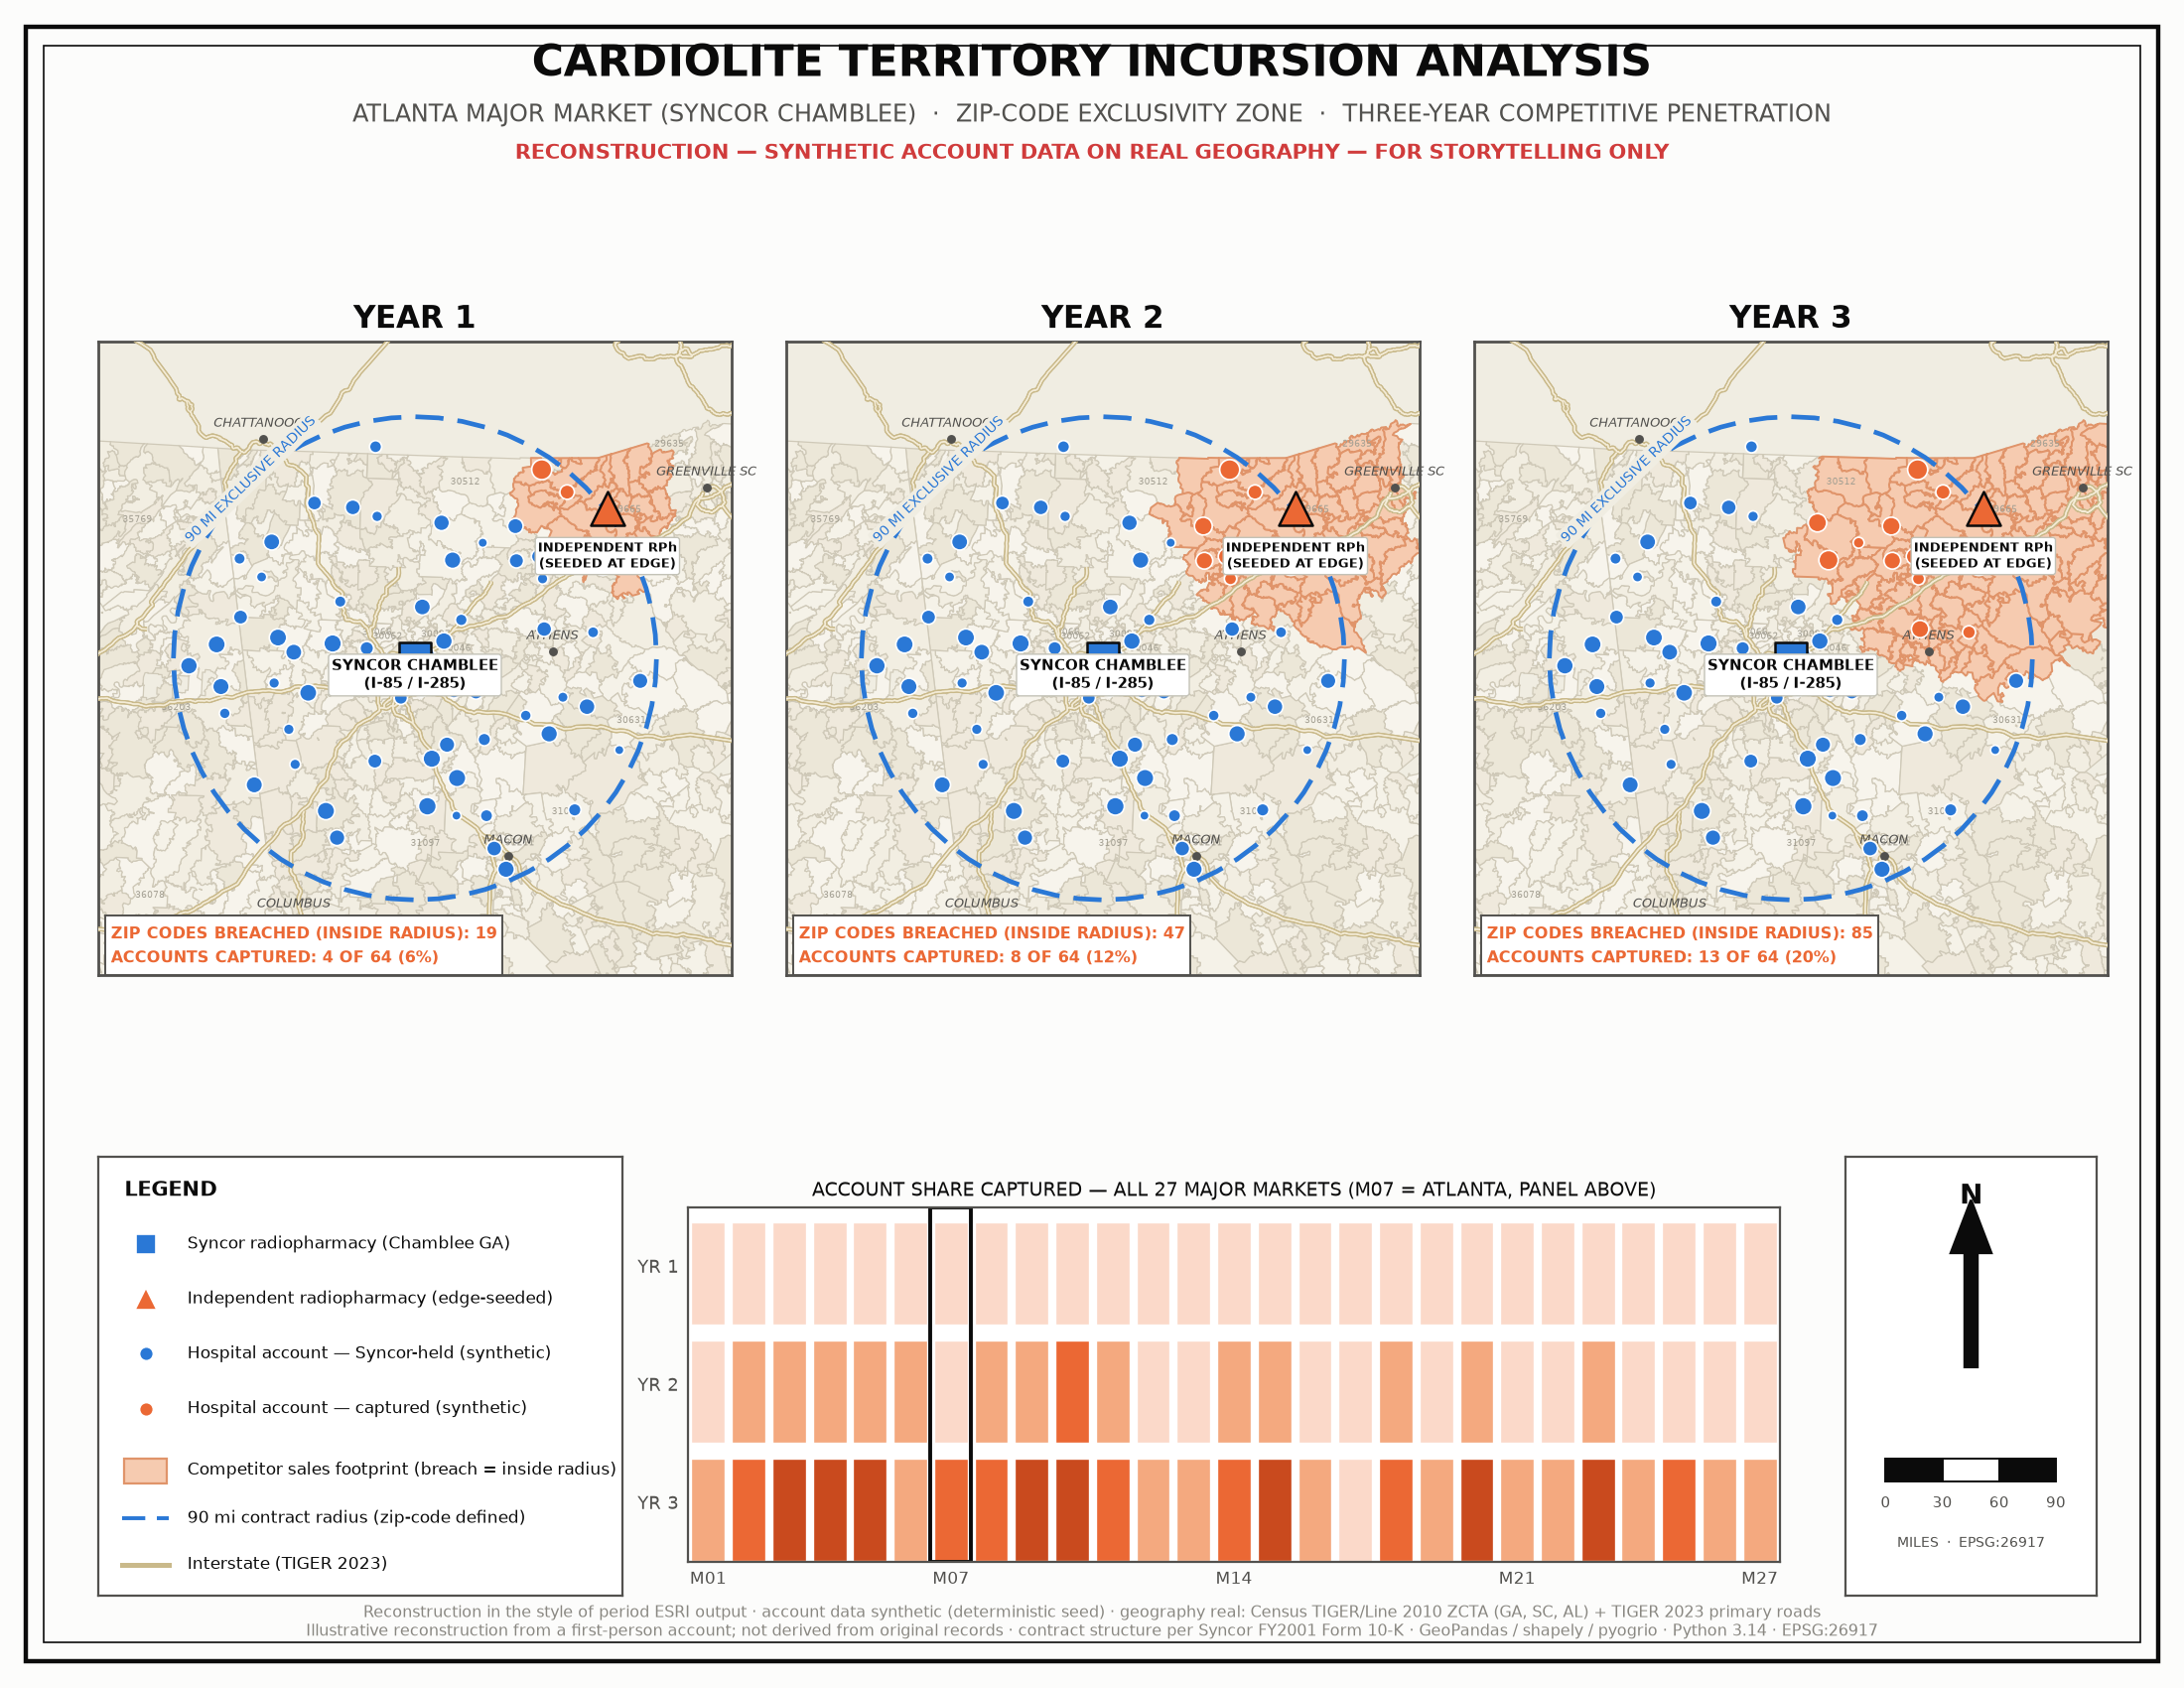
The 1990s version was Oracle Spatial, ESRI ArcSDE, and a night of hand transcription. The 2026 version, the image above, took one afternoon with GeoPandas, shapely, pyogrio, Census TIGER ZCTA polygons, a projected 90-mile buffer in EPSG:26917, and deterministic synthetic data. Same spatial predicates, same evidentiary logic, hundred-fold faster.
The skill that transfers isn't the tool. It's knowing that a pattern nobody can deny is a pattern shown in the data's own coordinates.
The evidence worked because the data quality work came first. End customers, zip codes, three years, every market, reproducibly. Decision-grade visualization is a chain of custody problem before it is a design problem. That discipline came from pharmacy practice law and NRC-regulated operations, and it is the same discipline GxP audit trails demand of AI pipelines today.